
Project EduLegacy · STAAR goal planning for Texas districts
Know exactly how many students each campus needs to move.
Project EduLegacy turns your STAAR results into goals every campus can act on: how many more students need to pass, which student groups are falling behind, and whether you are on pace before spring.
No sign-up needed for the demo. It runs on real public TEA results from a Texas district.
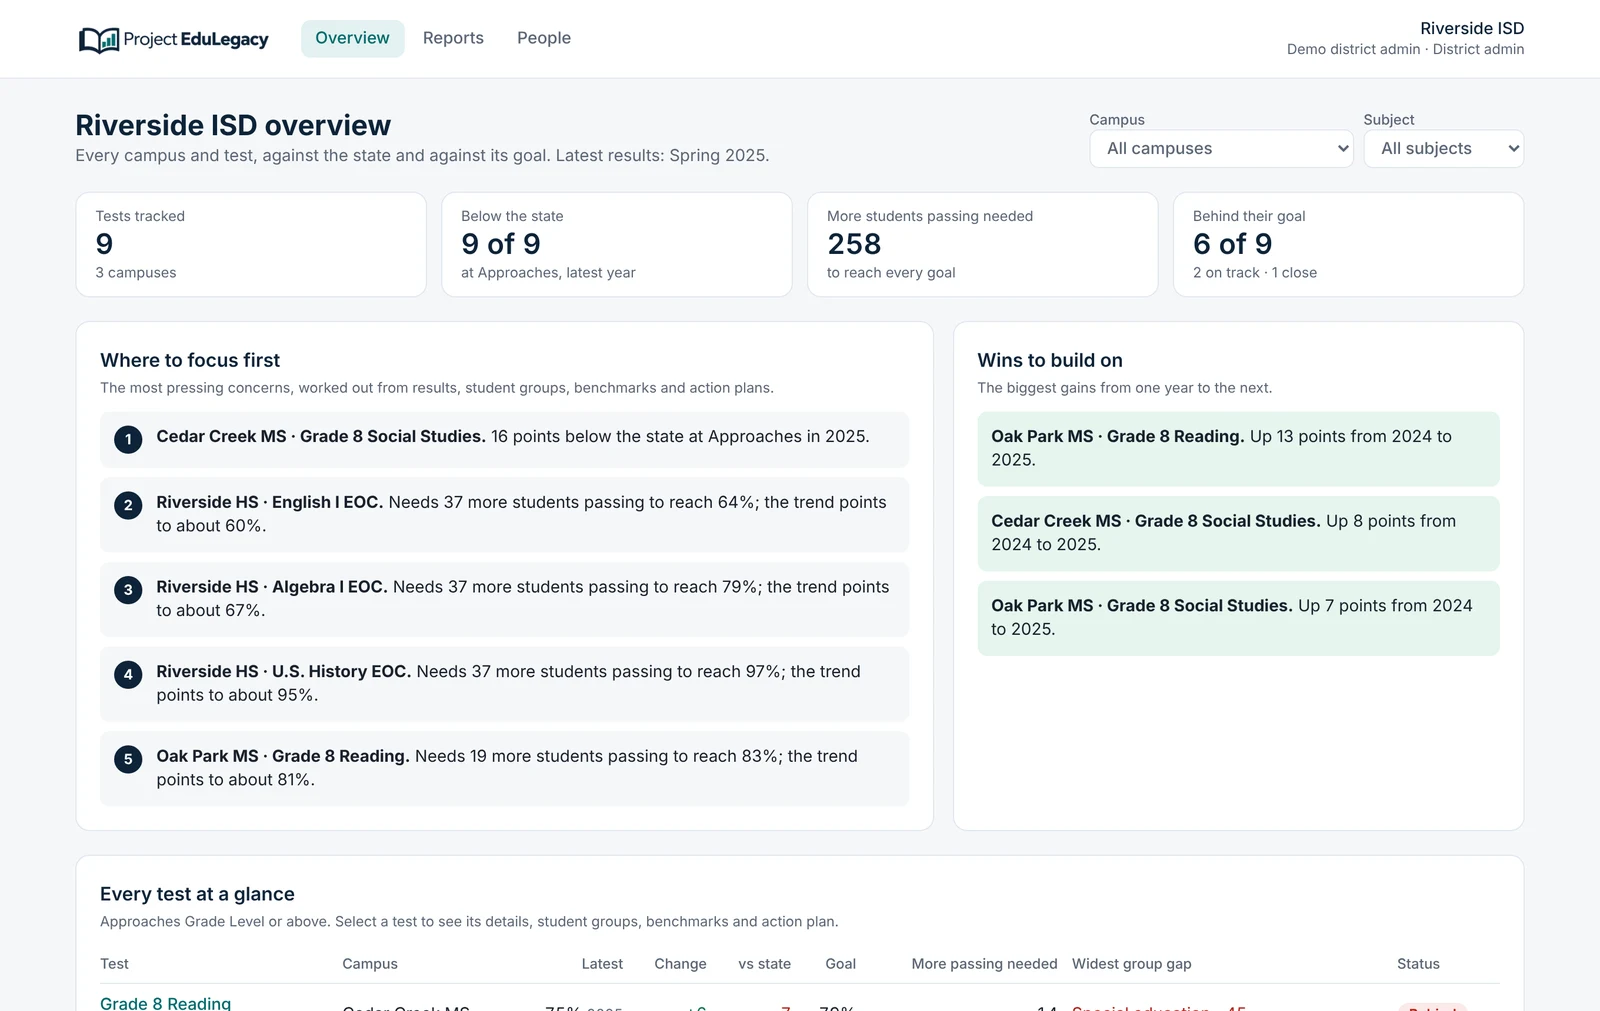

Results arrive in summer. Plans get written in the fall. By spring, nobody is sure whether the plan is working.
Every student in that room counts toward a campus goal. Most planning tools can’t say which ones, or how many.
Goals that don’t translate
“Raise Approaches by 4 points” doesn’t tell a principal which students, or how many, need to move.
Gaps hidden in the average
A campus can hit its overall goal while special education or emergent bilingual students fall further behind.
Hours rebuilding the same slides
Staff export, paste and re-chart the same numbers for every data meeting and board presentation.
How it works
From last spring’s results to a plan every campus can track
- 1
We load your results
Your campuses’ public TEA results, for all students and every student group, are in place before your first meeting.
- 2
Set goals as student counts
Each campus sets its goal and sees how many more students need to pass, and whether that is realistic against its trend.
- 3
Track benchmarks and actions
Campuses enter benchmarks and strategies through the year. The app shows who is on pace and what is overdue.
- 4
Report in one click
Print the board summary or a campus one-pager for every data meeting. No more rebuilding slides.
See the gap in students, not just percentages
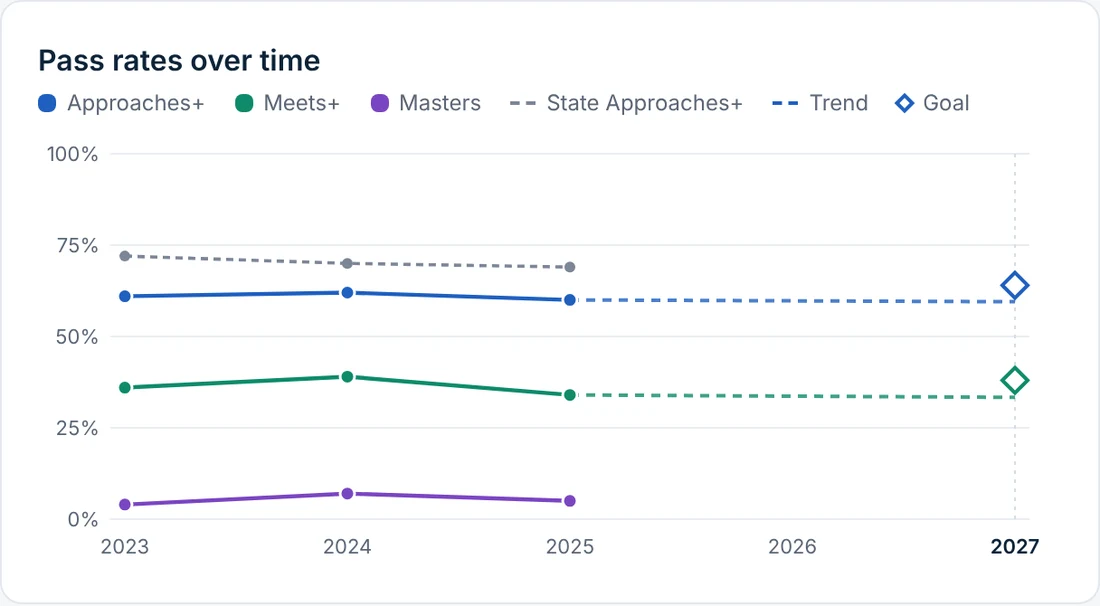
Every test shows its results over time against the state, the trend to your goal year, and exactly how many more students need to pass.
- Approaches, Meets and Masters side by side
- The state’s rate for the same year
- A trend line and an on-track, close or behind status
Find the groups the average hides
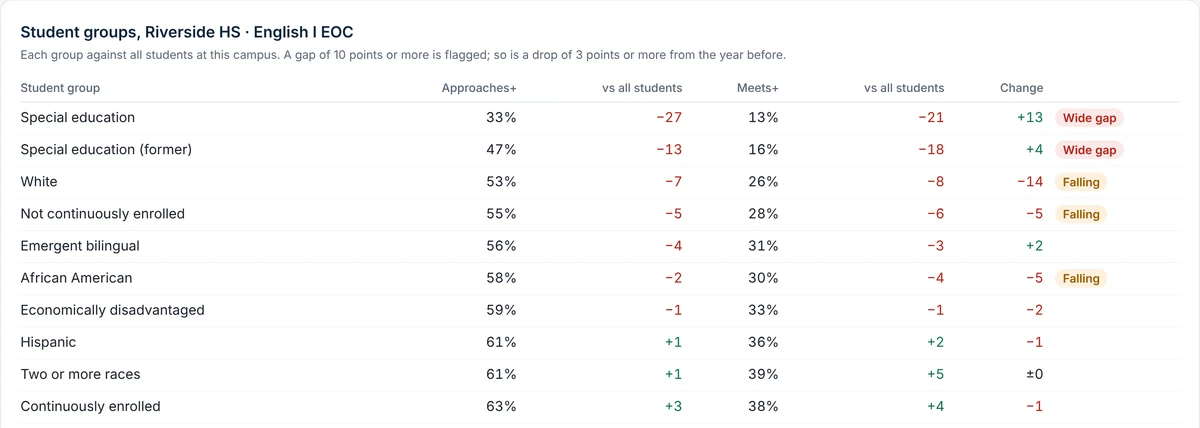
Each student group is compared with all students at the campus. Wide gaps and falling groups are flagged, so they reach the plan instead of getting lost in the average.
- Special education, emergent bilingual, economically disadvantaged and every race and ethnicity
- Gaps of 10 points or more flagged automatically
- Groups TEA masks for small size are left out, not shown as zero
Hand the board a report, not a spreadsheet
One click produces the district summary: where to focus first, wins to build on, every goal’s status and the widest student group gaps. Each campus gets its own one-pager too.
- Print or save as PDF
- Always current: no copying numbers into slides
- Plain-language priorities a board member can follow
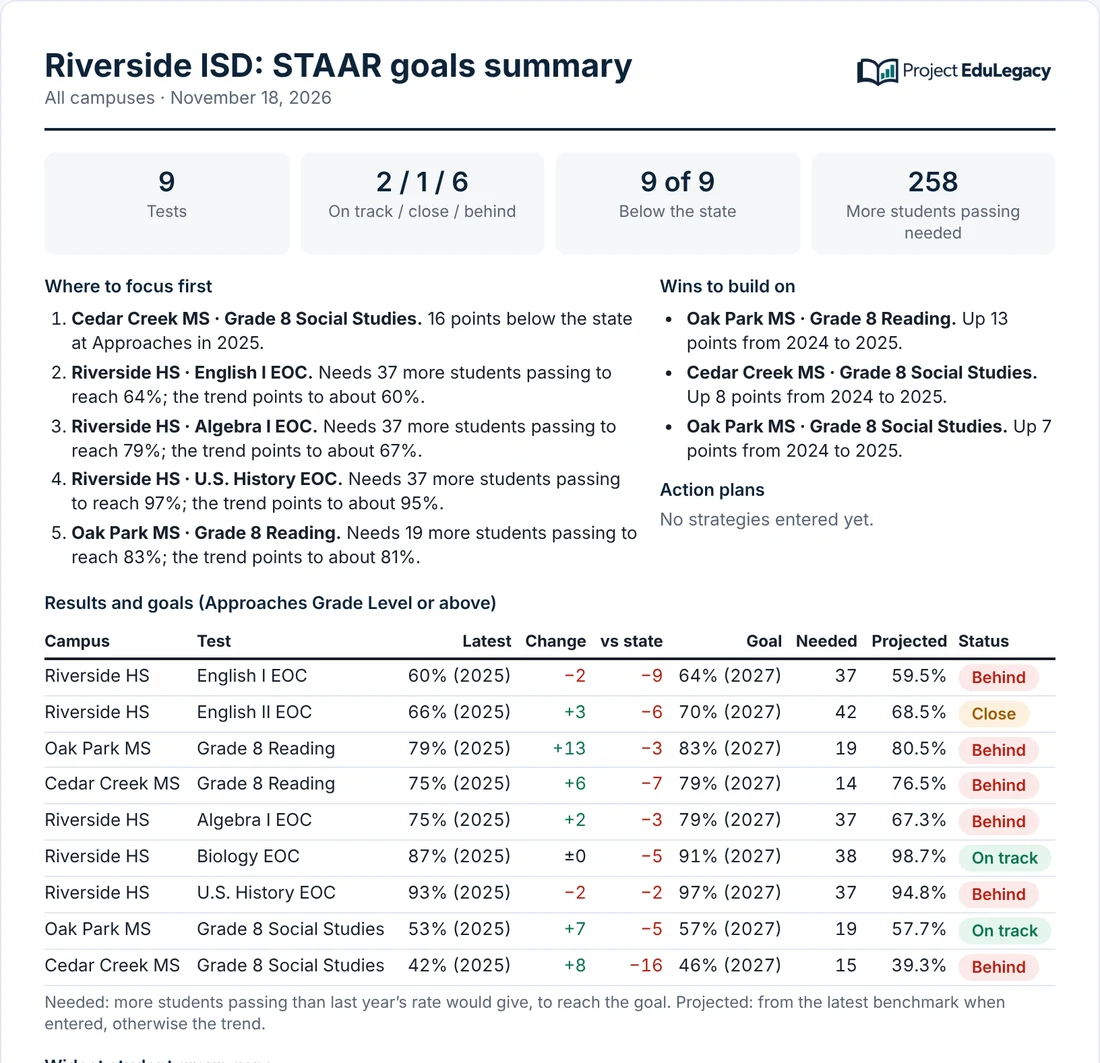
Screenshots use public TEA results from a Texas district, shown under a sample district name.
Features
Everything a campus needs to plan, and a district needs to lead
Goals as student counts
“Reach 64%” becomes “37 more students passing English I.” Every campus and test, with the gap to the state and the trend.
Every student group, not just the average
Special education, emergent bilingual, economically disadvantaged and every race and ethnicity, flagged when a group falls 10 points behind. The gaps Closing the Gaps measures.
On pace all year
Enter fall and winter benchmarks and see whether each campus is on track for spring, and how many students short, while there is still time to act.
Action plans attached to every goal
Strategies with an owner, due date and status, plus dated check-in notes. Overdue and stalled work surfaces on its own.
Board-ready reports in one click
A district summary for the superintendent and board and a one-page summary for each campus, ready to print or save as PDF.
Ready for House Bill 8
Built for the move from STAAR to beginning-, middle- and end-of-year tests in 2027–28, and for Spring 2027, the last English II end-of-course test.

One place for everyone working toward the goal
District leaders, campus teams and the board work from the same numbers, each with the access that fits their role.
- District leaders. See every campus, set direction and know where to send support first.
- Principals and CIS. See campus goals in student counts, enter benchmarks and keep the action plan in one place.
- Superintendent and board. A clear read-only view and a one-page summary for every board meeting.
Privacy and security
Built to pass your district’s privacy review
Project EduLegacy is designed so there is very little sensitive data to protect in the first place.
Read the privacy policy- No student-level dataSummary percentages only, like TEA publishes.
- Your district’s DPAWe sign your student data privacy agreement.
- Role-based accessEnforced by the database, not just the screen.
- District sign-inGoogle or Microsoft accounts; no new passwords.
- Change historyEvery edit is recorded with who and when.
- Hosted in the U.S.Never sold, never used for advertising.
Pricing
Simple, per-campus pricing
Purchase orders and invoices welcome. Unlimited users on every campus, so you never count seats.
Start here
Spring pilot
No cost
One campus through the Spring 2027 STAAR
- Your results loaded for you
- Goals, student groups, benchmarks and action plans
- Campus one-pager reports
District license
$600 per tested campus / year
$3,000 per year district minimum
- Every campus, test and student group
- Unlimited district, campus and viewer users
- District board summary and campus one-pagers
- Updates for the new 2027–28 state tests
Setup and training
$2,000 one time
Included with the pilot
- Your results history loaded and checked
- District admin setup and invitations
- One-hour data-meeting training for campus teams
Questions
Frequently asked questions
Does this replace Eduphoria or DMAC?
No. Those tools are built for digging into results. Project EduLegacy sits beside them and answers the planning question: what will it take to reach our goal, campus by campus, and are we on pace? It works from the same results your team already has.
What data do you need from us?
Nothing to start. We load your campuses’ public TEA results (all students and every student group) before your first call. To go further, campuses add their benchmark results during the year.
Do you store student-level data?
No. Project EduLegacy works from summary percentages only, the same kind TEA publishes. No student names, IDs or individual scores, which keeps privacy reviews simple. We will sign your district’s student data privacy agreement.
Who can see what?
District admins see and manage every campus. Campus users, such as CIS and principals, see and edit only their own campuses. Viewers, such as the superintendent and board, can see everything but change nothing. These rules are enforced in the database itself.
How do people sign in?
With their district Google or Microsoft account. There are no new passwords to manage, and a district admin invites people by email.
How long does setup take?
Your district’s history is loaded before kickoff. After a one-hour training session, campuses can start setting goals the same week.
What happens when STAAR changes in 2027–28?
Historical STAAR results stay as context, and the new beginning-, middle- and end-of-year tests can be tracked as they arrive. Trend lines won’t treat the two tests as directly comparable.
See your own district’s numbers
Before our first call, we load your campuses’ public TEA results into a private demo, so the walkthrough is about your goals, not a sample.